

A good conversion rate for a webinar or seminar usually falls within a typical range depending on the stage it describes, but exact numbers vary by context. For attendee-to-CTA conversion, a reasonable target for a warm, educational audience is a moderate to good rate often seen in practice. Skip to the worked example below once you're ready to run the actual math on your own numbers.
TL;DR:
- Matching your event's conversion rates to benchmarks requires careful tracking of each stage with the correct denominator and audience source.
- Most webinars see a 10% to 25% CTA engagement rate, while in-person seminars often outperform online average benchmarks.
- Tracking on-demand viewers separately from live attendees is essential to accurately measure engagement and conversion rates.
- Improving your webinar performance involves testing CTA placement and keeping registration pages simple with minimal fields and a single call to action.
- Maintaining consistent attribution windows and CRM tagging is crucial to avoid double counting leads and ensure reliable quarter-over-quarter comparison.
Table of Contents
- How Do You Calculate Seminar Conversion Rate by Stage?
- What Are Realistic Seminar and Webinar Benchmarks?
- Worked Example: Calculating Every Stage From One Event
- How Should You Benchmark and Report These Numbers Fairly?
- Which Tactics Actually Move Conversion Rates?
- How Do You Keep Your Conversion Numbers Honest?
- What Does Conversion Rate Mean for CAC and ROI?
- How Advisors Apply These Benchmarks in Practice
- A Practical Next Step Worth Taking This Week
- Turn Your Numbers Into Booked Appointments
- Sources
How Do You Calculate Seminar Conversion Rate by Stage?
There's no single "seminar conversion rate." There are at least four, and treating them as one number is the fastest way to misread your own data.
Visitor-to-registration rate measures how many landing-page visitors complete a registration form: completed registrations divided by qualified landing-page visitors, times 100. "Qualified" matters here. Bot traffic and accidental clicks inflate your denominator and quietly tank the percentage.
Registration-to-attendance rate is unique live attendees divided by valid registrants, times 100. A valid registrant is someone who submitted real contact information and received at least one confirmation or reminder. Registrants who bounced on a bad email address shouldn't count against you.
Attendee engagement and CTA completion use an "exposed-to-CTA" denominator. Only count people who actually saw the offer. This distinction, Univid's own definitions make clear, changes results dramatically since a CTA shown to 40 attendees but clicked by 40 out of 200 registrants tells a very different story.
Attributed sales rate requires a defined attribution window. HeySummit's breakdown of stage-specific formulas is the clearest public explanation of why denominator choice changes everything.
What Are Realistic Seminar and Webinar Benchmarks?
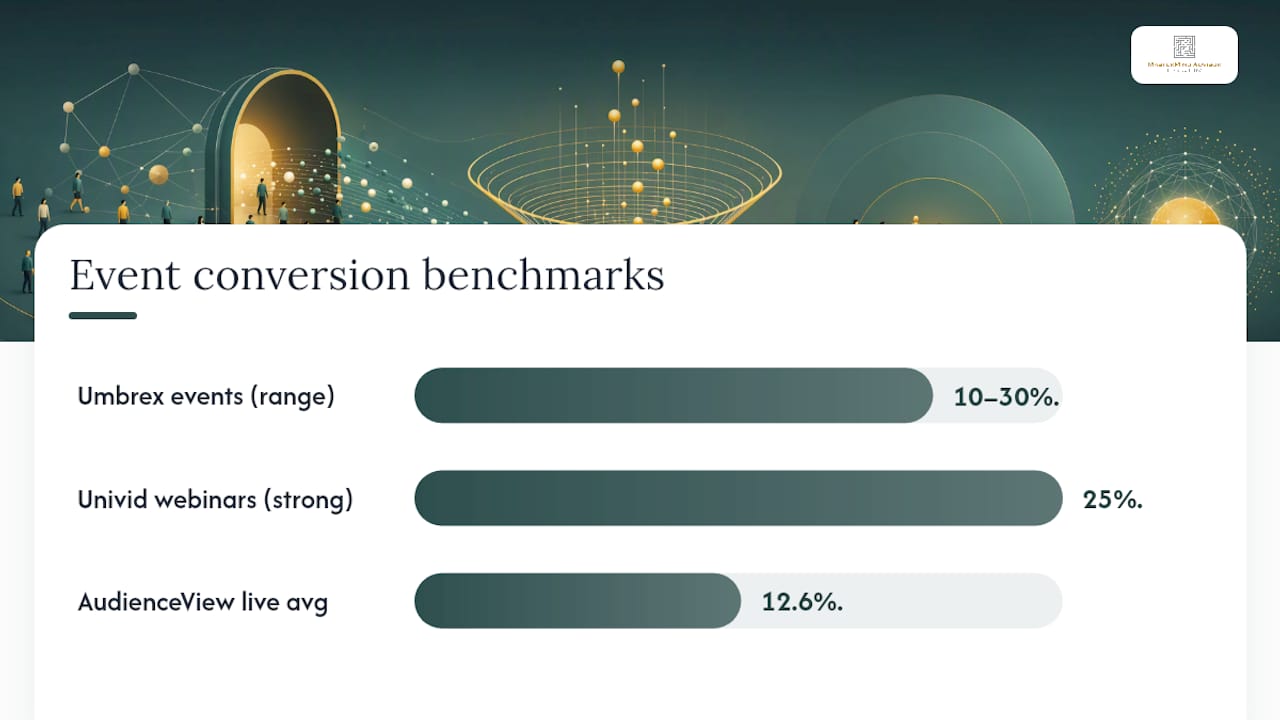
Numbers without context are just noise. Umbrex's analysis of event-driven lead generation puts general event lead conversion between 10% and 30%, depending heavily on event type and how aggressively you follow up afterward.
Zoom in on webinars specifically and the picture sharpens. Univid reports that a 25% conversion rate on CTA clicks or engagement counts as strong, while 10% is still considered decent. Separately, AudienceView's benchmark study found a 12.6% average online conversion rate for live events in its dataset. This figure sits comfortably inside the wider range but reflects a different sample and methodology.
Educational webinars aimed at cold traffic tend to land at the bottom of these ranges. In-person seminars, where attendance itself signals real intent, frequently outperform both. Treat every published figure as a reference point for sanity-checking your own numbers, not a scoreboard you're required to beat.
Worked Example: Calculating Every Stage From One Event
Here's a single hypothetical webinar broken into its component rates, using round numbers to make the math easy to follow.
Start with 1,000 qualified landing-page visitors. 250 complete registration, giving a visitor-to-registration rate of 25%. Of those 250 registrants, 150 show up live, for a registration-to-attendance rate of 60%, matching the kind of figure platform benchmarks like ON24's have reported for hosted events. Another 40 watch on demand within the following week, worth tracking separately since on-demand behavior differs from live behavior.
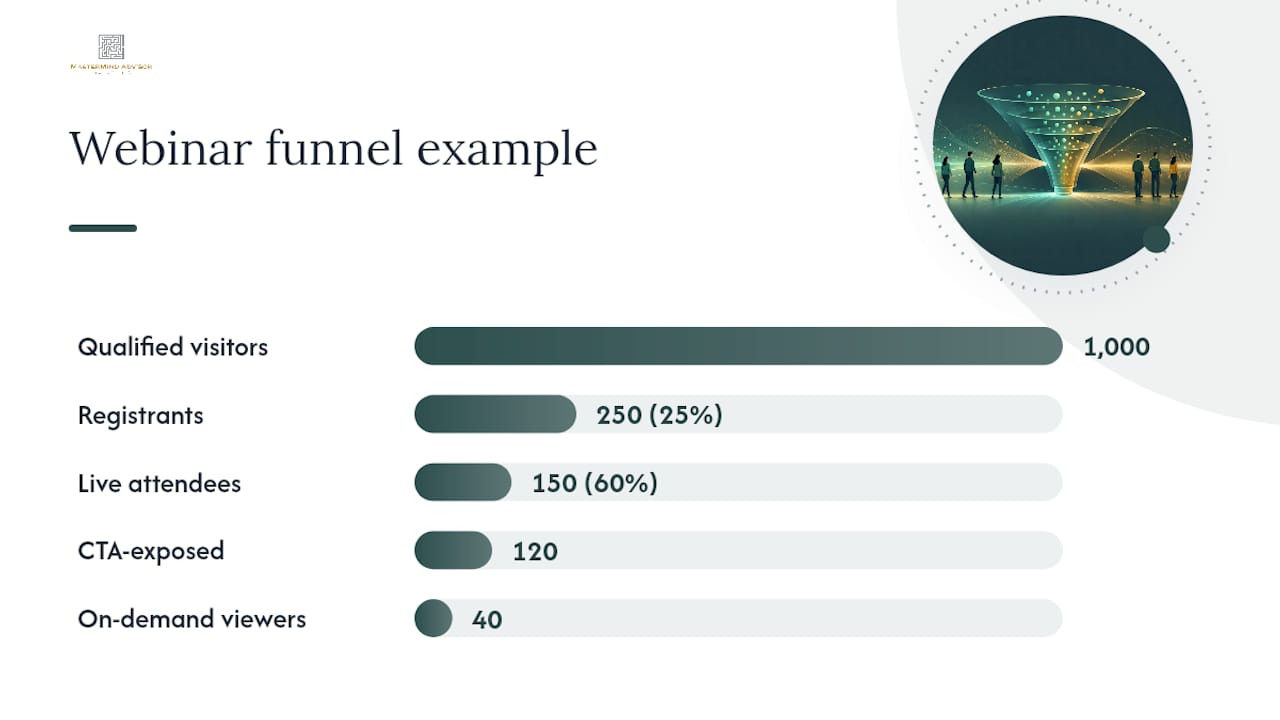
Of the 150 live attendees, 120 stay through the CTA moment, meaning 120 is your exposed-to-CTA denominator.
How Should You Benchmark and Report These Numbers Fairly?
Comparing your 22% CTA rate to a competitor's 30% is meaningless unless both numbers use the same denominator, and HeySummit's guidance on stage-specific tracking backs this up directly.
Record six things for every event: funnel stage, exact denominator, event type, audience source, attribution window, and the year or platform the comparison figure came from. Small events produce noisy percentages. A single extra sale on a 20-person webinar swings your rate by 5 points, so don't overreact to one outlier event. Segment your own historical data by audience source and report on a rolling quarterly basis instead of chasing single-event spikes.
Which Tactics Actually Move Conversion Rates?
Improvement happens stage by stage, not through one universal fix.
- Ask two or three qualifying questions on the registration form so you can segment follow-up by intent later.
- Keep registration pages to a single call-to-action, minimal form fields, and one piece of social proof.
- Cap live sessions at 45 to 60 minutes and place your first soft CTA around the midpoint, not just at the end.
- Use polls and live Q&A to keep attendees engaged past the 20 minute mark, where drop off typically accelerates.
- Send behavior-triggered follow-up emails within 24 hours, routing clickers to a CTA-specific landing page rather than a generic homepage.
Pro Tip: Run your first A/B test on CTA timing before touching CTA copy. Moving the offer from the final slide to the session midpoint often outperforms a full script rewrite, and it's a one-line change in your presentation deck.
The partner guide on conversion rate optimization covers registration-page testing frameworks that apply directly to event landing pages.
How Do You Keep Your Conversion Numbers Honest?
Set a 7 to 30 day attribution window for CTA-driven conversions, and pick the same window every time so quarter-over-quarter comparisons stay valid.
Three integrations matter most: consistent UTM tagging on every promotional link, a unique CTA link per campaign so clicks don't get lumped together, and CRM event IDs that tie a specific registrant to a specific event session.
Watch for three recurring mistakes: counting the same lead twice across live and on-demand viewing, including registrants who never received a single reminder email in your attendance denominator, and blending live and on-demand numbers into one rate without labeling which is which.
What Does Conversion Rate Mean for CAC and ROI?
Conversion rate only matters once it's translated into cost. Sequel's comparative analysis reports webinar cost-per-lead around $72, against $800 or more for in-person seminars, largely due to venue, catering, and staff time.
Run the math backward: if a webinar costs $3,000 to produce and converts 6 leads into clients, your CAC is $500 per client. A seminar at $4,000 that converts 4 clients puts CAC at $1,000. Higher seminar costs still make sense when the average client's lifetime value is high enough, or when the sales cycle involves trust that only an in-person room can build.
How Advisors Apply These Benchmarks in Practice
Independent financial advisors face longer sales cycles and stricter compliance requirements than most B2B marketers, which changes how these formulas get used day to day. A compliance-friendly invitation sequence, a dinner seminar with a structured RSVP flow, and a webinar follow-up cadence built for suitability rules all need the same denominator discipline covered above.
For deeper implementation detail, see our guides on advisor seminar tactics, advisor webinar lead generation, and funnel stage mapping for advisors.
A Practical Next Step Worth Taking This Week
Pull your last three events and check whether each rate names its denominator. Most don't. Then A/B test CTA placement before anything else. Start with the email follow-up templates if your follow-up sequence is the weak link.
— Josh
Turn Your Numbers Into Booked Appointments
This service is the direct path to better seminar and webinar conversion for advisors who don't have time to build denominators, CRM triggers, and follow-up sequences from scratch. Instead of assembling compliance-friendly templates, automated email drips, and CRM integrations piecemeal, you get a turnkey system built specifically for long sales cycles and regulatory realities of financial advisory marketing.

That means custom webinars and seminars paired with automated follow-up that fires on relevant behavioral triggers, tracked inside a CRM designed for financial advisor workflows rather than retrofitted from generic marketing software. If your last event's numbers left you guessing which stage actually broke down, book a marketing audit and get a clear read on where your funnel is actually leaking.
Sources
- Conversion rate in webinars: Your ultimate guide — Univid
- Lead Conversion Rate from the Event Analysis — Umbrex
- Industry Benchmark: Online Conversion Rates for Live Events — AudienceView
- Webinar vs Seminar: Revenue Impact & ROI for B2B Teams — Sequel
- What are webinar conversion rates and how to optimize them — HeySummit